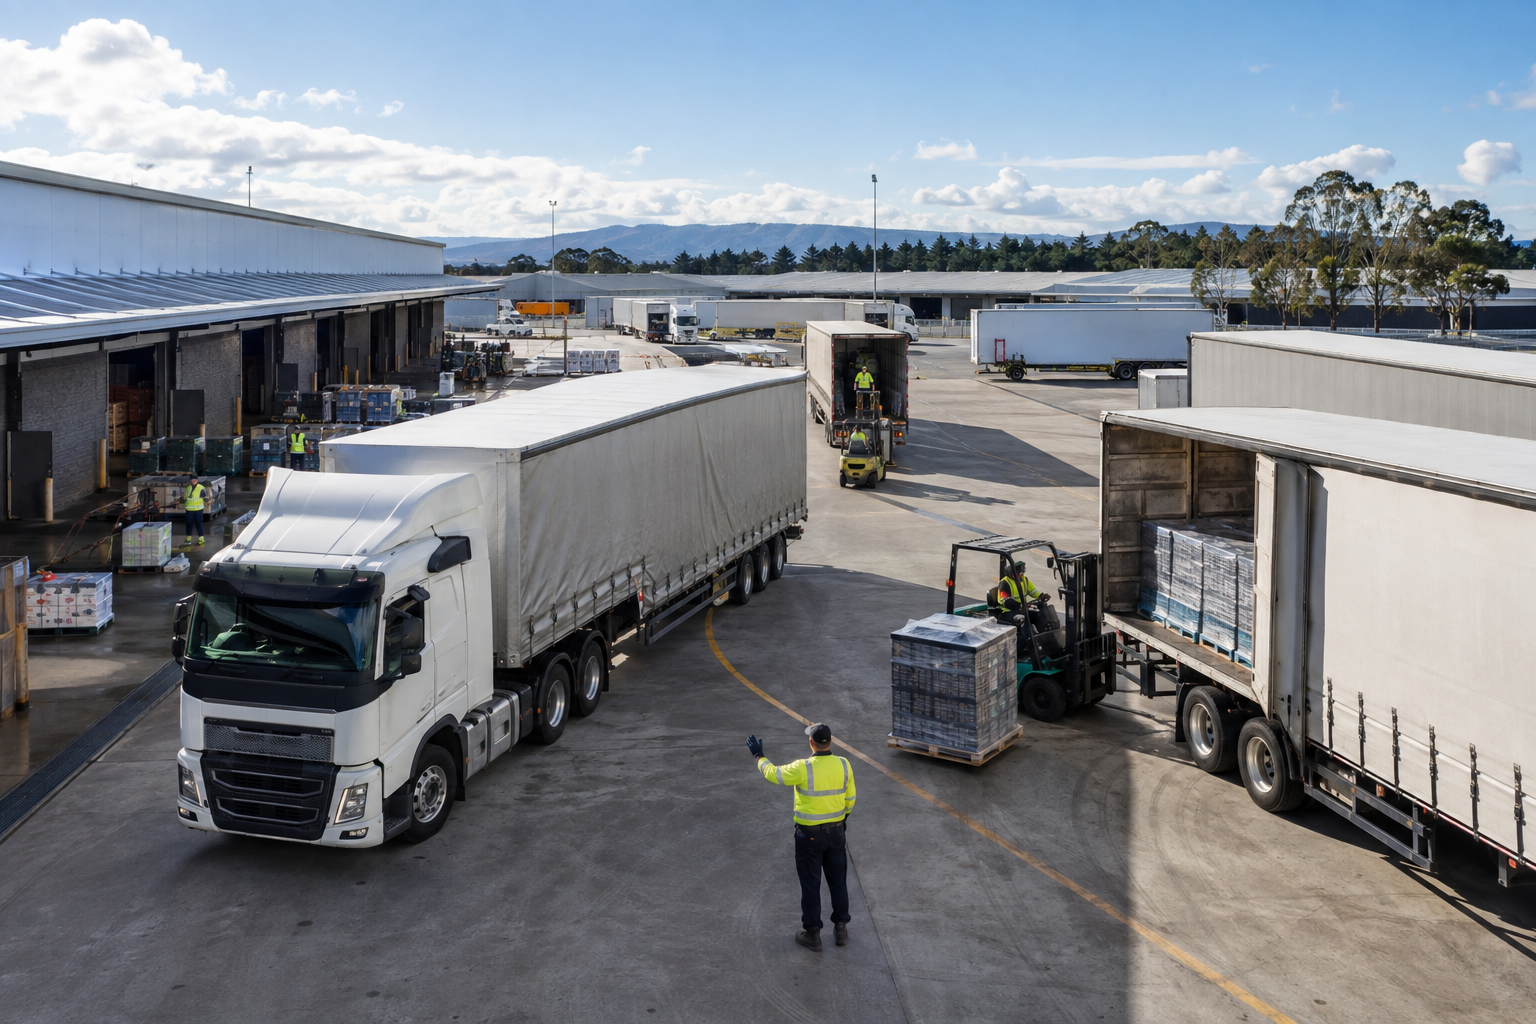
Transport profitability down to the load
Allocate revenue and operating cost to the work that created them, then see which trucks, lanes, customers, projects and loads truly contribute.

Start with unit economics the operation trusts
Cost per kilometre and revenue per kilometre create a common language for finance and transport. Build them from agreed sources: completed jobs, distance, fuel, wages, maintenance, leases, tolls and other operating costs. Keep the assumptions visible so people can explain a result instead of debating the spreadsheet.
Add operating ratio and fuel cost as a percentage of revenue to show whether margin is moving because of price, productivity or cost. Review these measures by comparable period and operating context.
- Reconcile revenue to completed transport work
- Separate fixed, variable and directly attributable costs
- Track fuel cost as a percentage of revenue
- Monitor operating ratio and contribution over time
Allocate cost where decisions are made
Direct costs such as fuel, tolls and driver hours can often be assigned to a job or vehicle. Shared costs need a consistent allocation rule based on distance, time, capacity or another driver the team understands. The goal is decision-grade accuracy, not false precision.
Once allocation is stable, compare revenue and cost by truck, driver, job, route, lane, customer and project. Keep both direct contribution and fully allocated margin available so short-term dispatch choices are not confused with long-term commercial decisions.
Move from averages to action
A profitable customer can still contain unprofitable loads, and a strong lane can hide a costly direction. Drill from the executive result into the individual movements that explain it: waiting time, empty kilometres, special handling, failed delivery, under-used capacity or an outdated rate.
Revenue per truck and revenue per customer show concentration and productivity. Load acceptance analysis shows whether quoted work fits the network. Together, these measures help commercial and operations teams change pricing, scheduling or service design before margin disappears.
- Compare lane profitability in both directions
- Find customers and projects with rising service cost
- Review low-margin loads before renewing rates
- Connect profitability exceptions to an owner and action
Explore TrackIt