
The executive transport dashboard
Create one management view that connects today’s exceptions with the trends, targets and profitability measures that shape tomorrow.
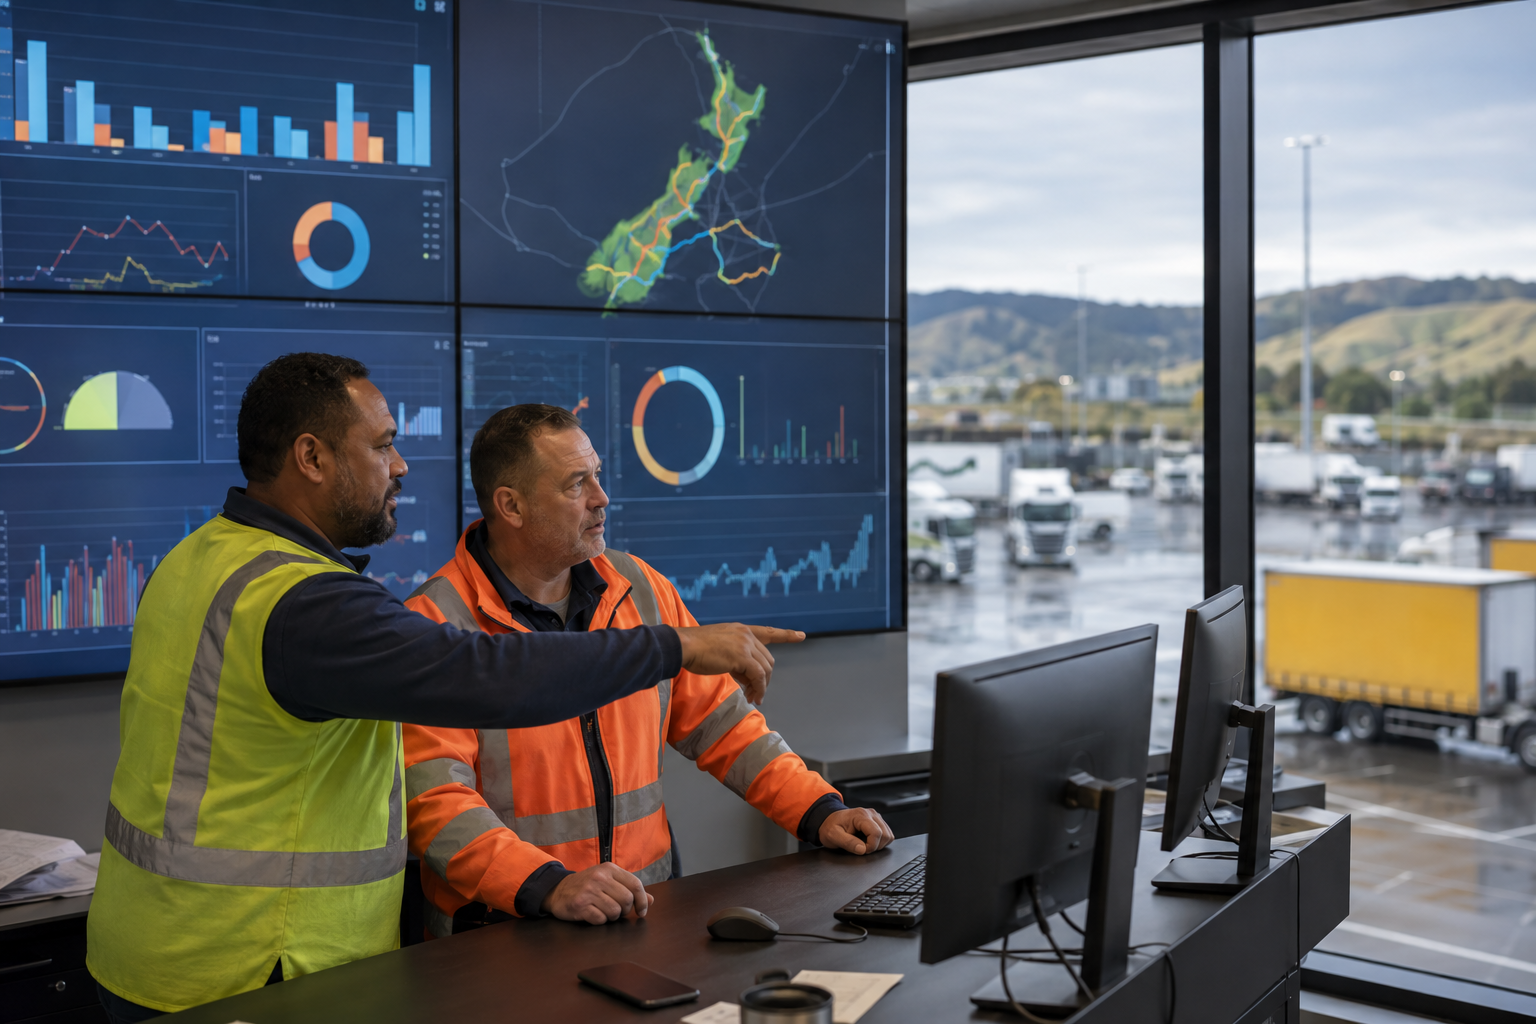
Lead with the decisions that matter today
An executive dashboard should not be a gallery of every available metric. Begin with the operating questions leaders must answer: Is the fleet safe and available? Are loads moving on time? Is utilisation where it should be? Are service and margin at risk?
Use real-time operational KPIs for active work and make exceptions visible before averages. A late load, idle vehicle, missed pre-start or maintenance risk needs an owner and a next action—not just a red number.
- Show active loads, on-time performance and service exceptions
- Track available, active, idle and down vehicles
- Surface safety, compliance and maintenance risks
- Link every exception to detail and ownership
Automate the management rhythm
Daily reporting should help the team run today. Weekly reporting should identify recurring exceptions. Monthly and quarterly views should explain trend, progress against target and the commercial impact of operational change.
Connect telematics, transport management, fuel, payroll and accounting data so KPIs calculate automatically from governed definitions. BI integration can then distribute role-specific views and scheduled management reports without repeated spreadsheet assembly.
- Use one definition for each KPI across every report
- Highlight trends and exceptions before static totals
- Schedule daily, weekly, monthly and quarterly reporting
- Keep an audit trail back to the source transaction
Explore TrackIt